Threshold Solver
The Threshold solver compares the Input value against any number of threshold levels. This solver is primarily used to identify when an indicator is above or below a certain value (a threshold value). e.g. This solver would be used to identify the following conditions; when the CCI is above 100 or below -100. Or, when the Stochastics is above 80 or below 20, and vise-versa. Or, if the MACD is above zero or below zero. Those numeric values are threshold levels/values.
Tip: If you want to compare an indicator to another indicator, or bar prices, or some other non-fixed numeric value, then use the Comparison solver.
BloodHound v2
Properties tab
Properties tab
Global Properties
Global Properties
Behavior
Input
This section determines what kind of data the solver will evaluate. Use the Type drop-down menu to select the data type.
The menu will change based on which data type is selected. Click on Type to see the various data types available and the corresponding documentation.
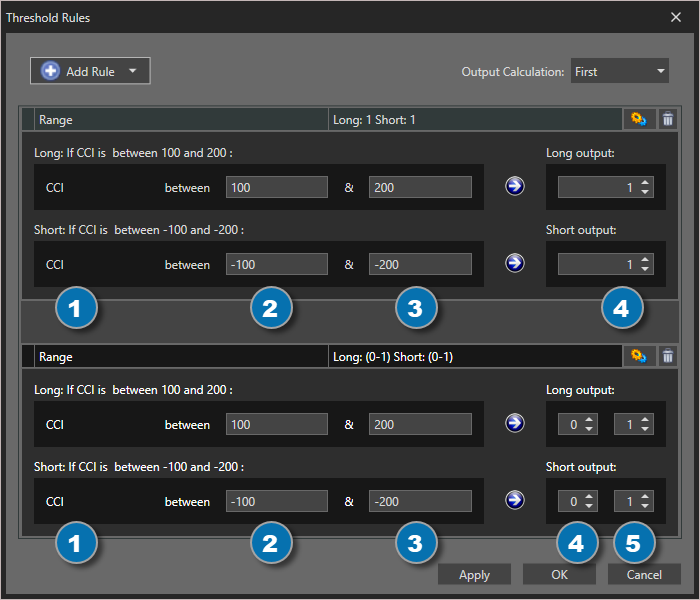
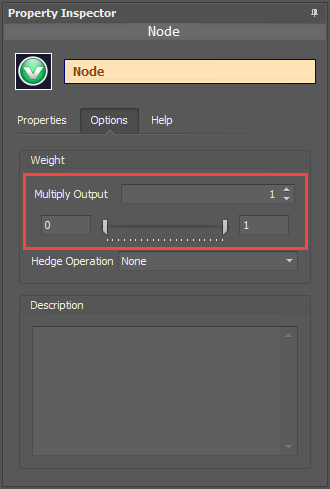
Output Rules
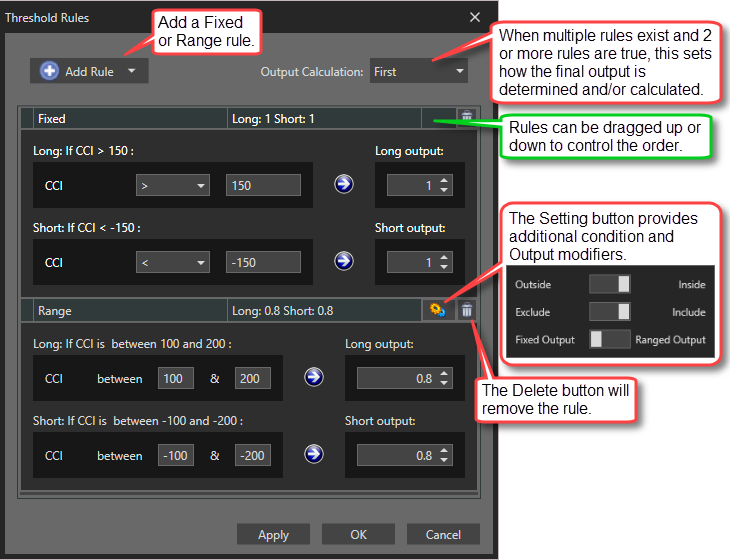
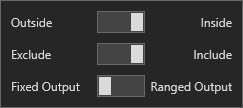 Settings window: This applies to the Range rule. It provides more detailed control over the values being evaluated.
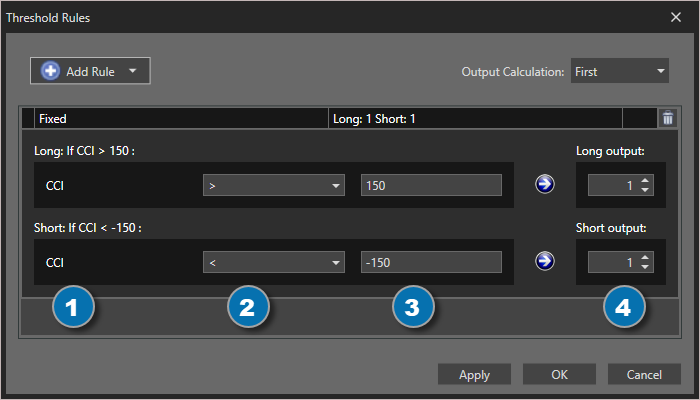

Options tab
Options tab
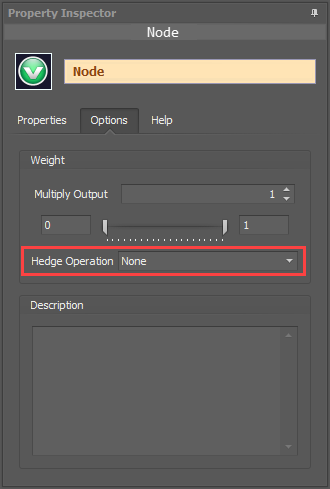
Description
Description
This text area provides a place to write a full description of what the node is doing, used for, or what ever you want.
Note: The Description is global to all instances of the node. It is not applied individually to each instance as the Weight controls are.
Help tab
Help tab
This tab displays the documentation page (from this web site) of the selected node.
Please note: NinjaTrader v8.0.26.0 or newer is required for the built in web viewer to work, and thus the documentation to be displayed.
Examples
This video gives a basic example of how to detect when price interacts with a specific threshold level. It shows this using 3 different solvers, including the Threshold solver:
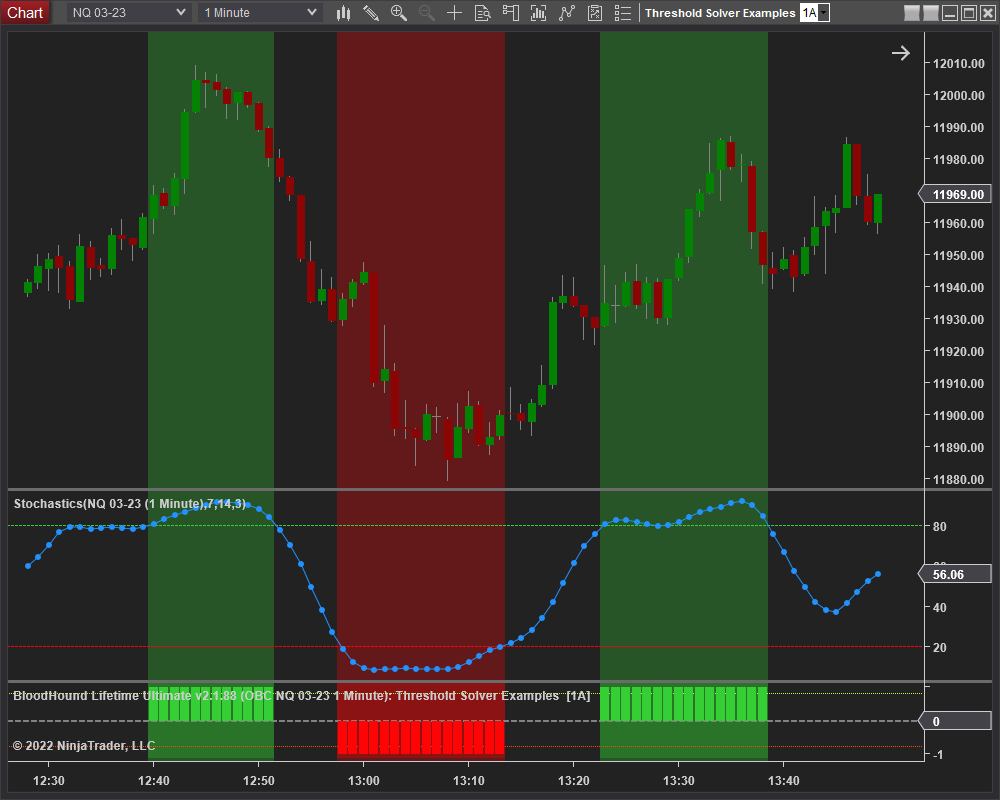
Example 1A: The Basics
This demonstrates a basic function of the Threshold solver using the Stochastics » D plot. This Solver detects overbought, above 80, and oversold, below 20, conditions of the Stochastics » D.
Input Settings:

- Set Indicator to Stochastics » D.
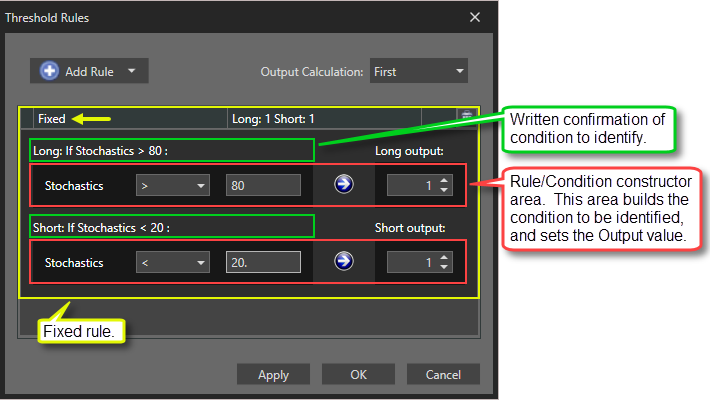
Rules window Settings:
Open the Rules window by clicking the ellipses button in section Output » Threshold Settings.
- Set Thresholds values as shown.
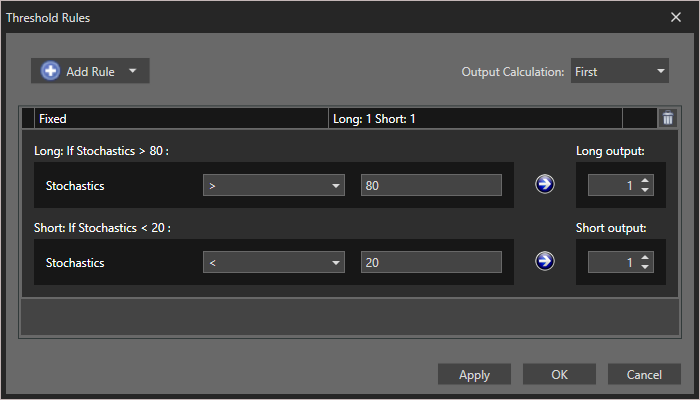
The chart below shows a Long output when the Stochastics D is above 80, and a Short output when it is below 20.
Example 1B: The Basics with Volatility
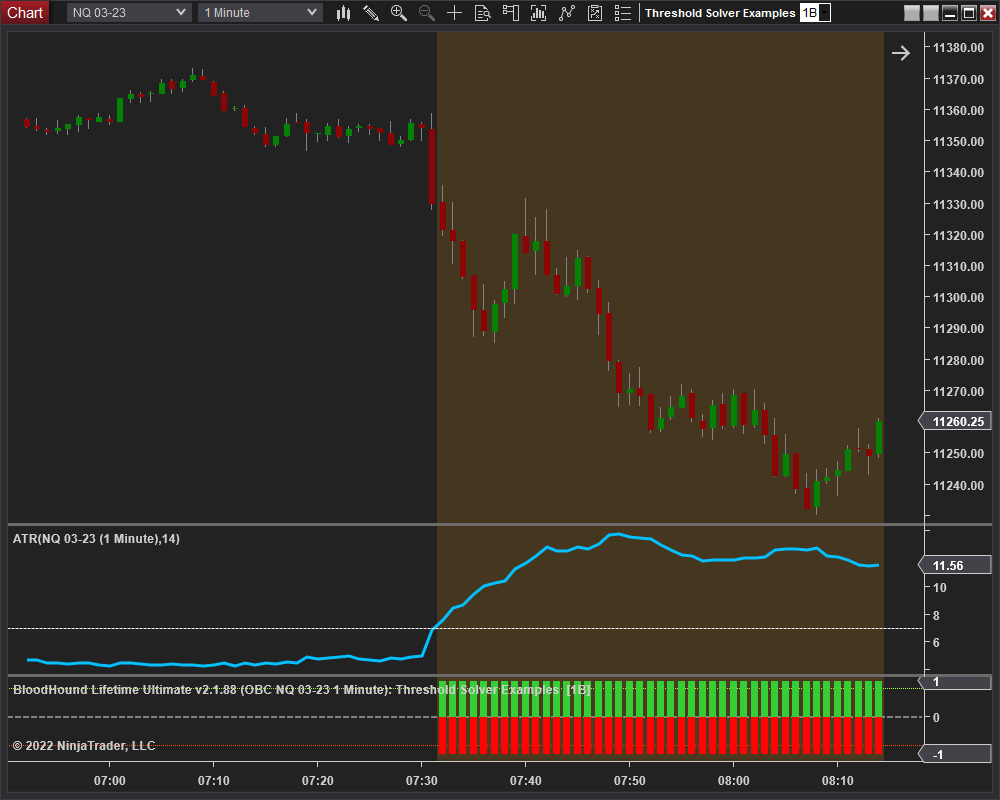
This demonstrates a basic function of the Threshold solver to detect volatility. This Solver detects when the ATR is above 7. Some systems may need or take advantage of increased volatility to work well. The chart below shows when an increase in active trading picks up.
Input Settings:

- Set Indicator to ATR.
Rules window Settings:
Open the Rules window by clicking the ellipses button in section Output » Threshold Settings.
- Set Thresholds values as shown.
- Note the Long & Short settings are the same.
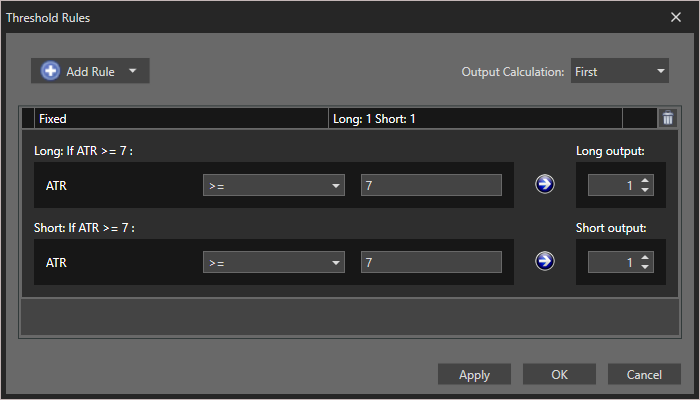
The chart below shows a Long & Short output when the ATR goes above 7. The ATR is a non-trend directional indicator, which is why there is a Long & Short output at the same time.
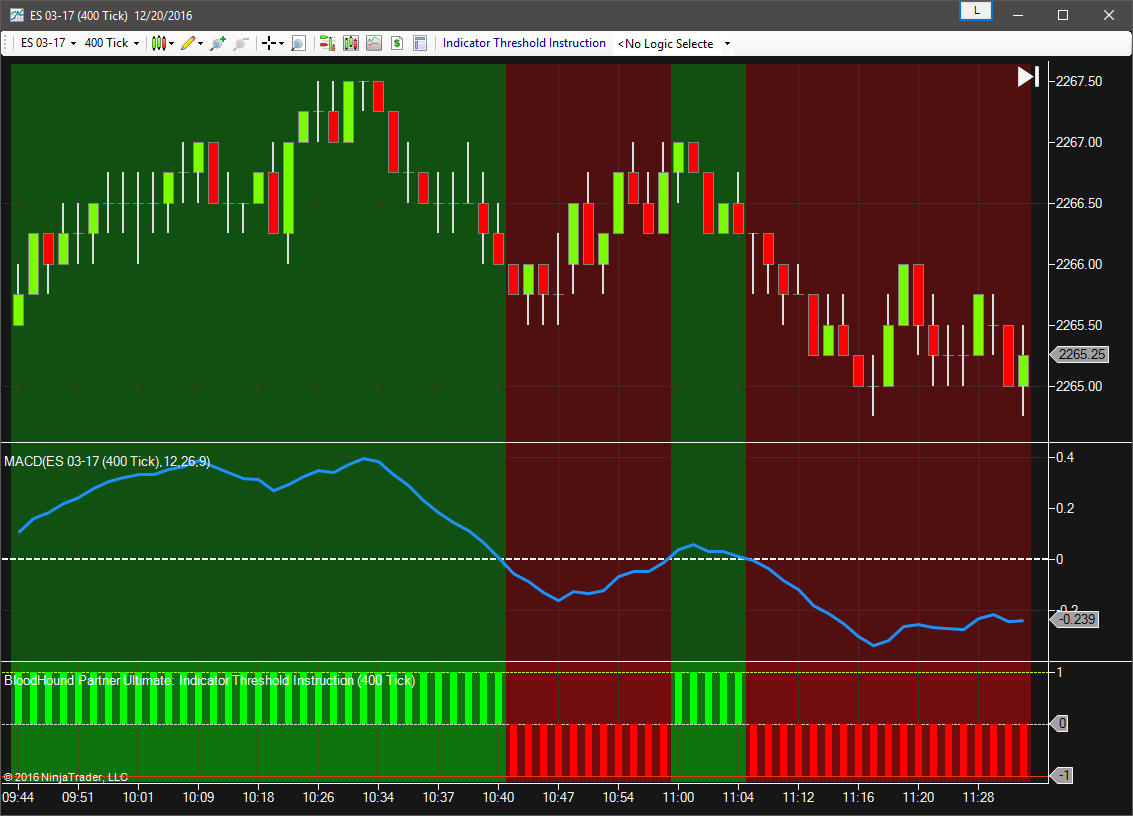
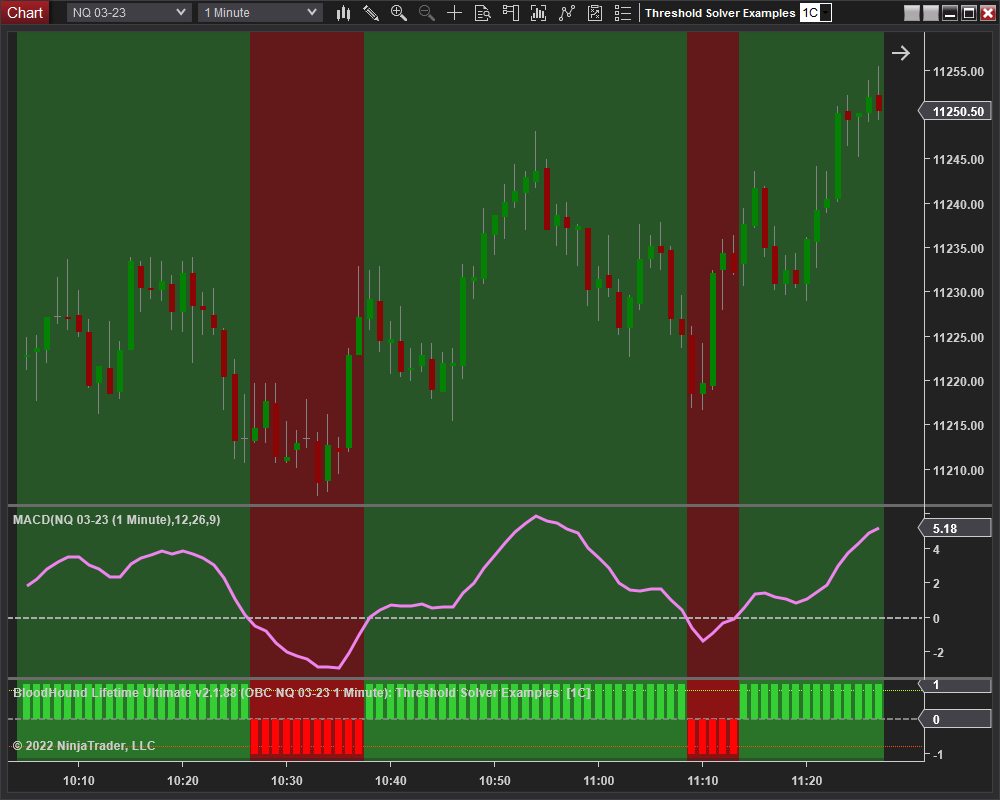
Example 1C: A Basic MACD Filter
This demonstrates another basic function of the Threshold solver using the MACD line. This Solver will identify if the MACD is above the zero line for a long filter, or below the zero line for a short filter. The zero line threshold of the MACD switches the output between Long and Short.
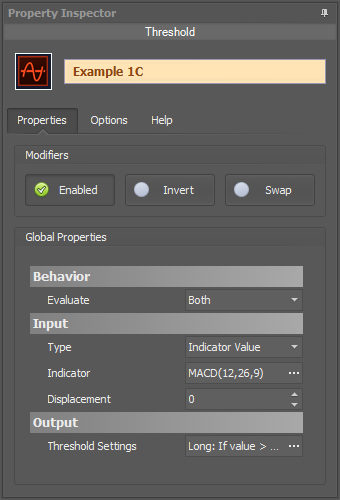
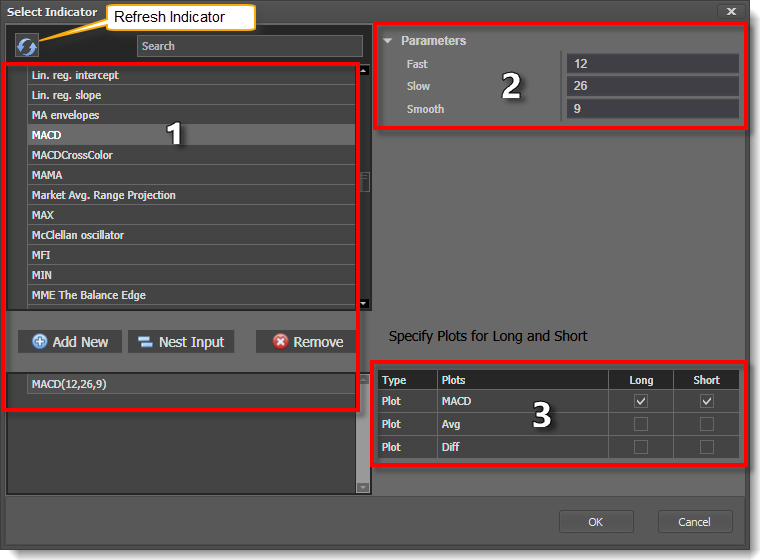
- Set Indicator to the MACD.
Rules window Settings:
No changes to the Rules window is necessary.
The chart below shows a Long output when the MACD is above zero, and a Short output when it is below zero. Quite a simple filter.
Example 2A: Using A Discretionary S/R Level
This demonstrates a simple way to use a discretionary support/resistance level to filter long only trading above a price level, or shorts only below that price level. The Solver identifies when the closing price is above or below the discretionary level.
Input Settings:
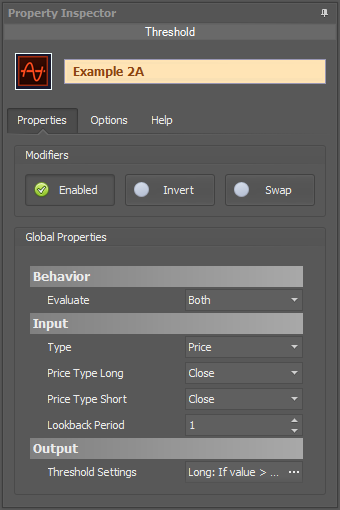
- Set Input » Type to Price.
Rules window Settings:
Open the Rules window by clicking the ellipses button in section Output » Threshold Settings.
- Set Thresholds values as shown.
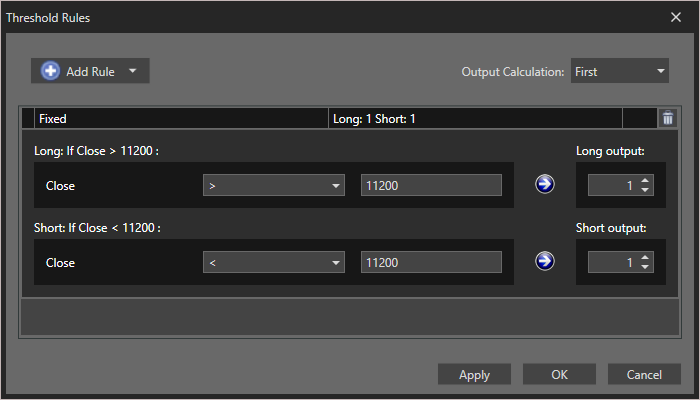
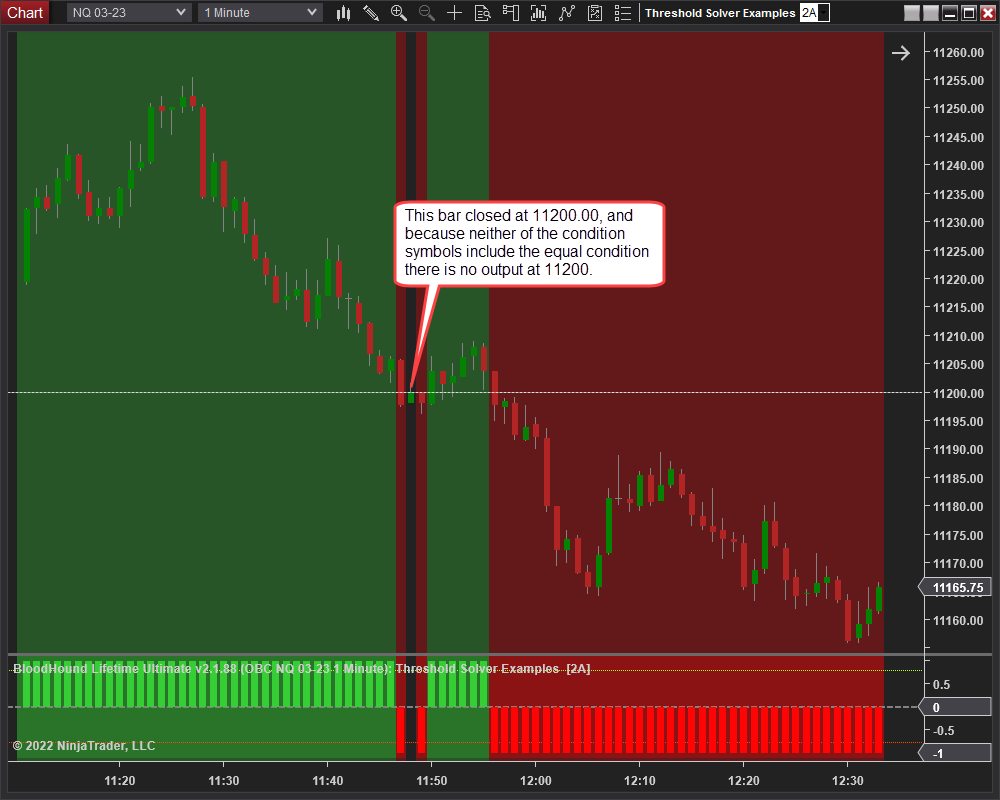
The chart below shows a Long output when the close price is above 11,200.0, or a Short output when the close is below 11,200.
Example 2B: Two Discretionary S/R Levels
This demonstrates using two discretionary support/resistance levels. When the market (closing bar price) is above the lower S/R level a long only filter is applied. When the market is below the upper S/R level a short only filter is applied. When the market is between the two levels both long and short signals can occur.
Input Settings:

- Set Indicator » Type to Price.
Rules window Settings:
Open the Rules window by clicking the ellipses button in section Output » Threshold Settings.
- Set Thresholds values as shown.
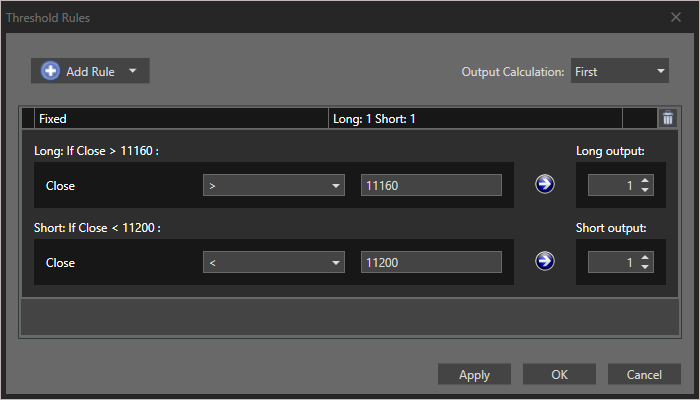
The chart below shows a Long output when the close price is above 11,160.0, a Short output when the close is below 11,200, and of course a Long & Short output when the close is between the two levels.

BloodHound v1
Indicator Threshold Solver
The Threshold solver compares the Input value against 5 possible threshold levels. This solver is primarily used to identify when an indicator is above or below a certain value (a threshold value). e.g. This solver would be used to identify the following conditions; when the CCI is above 100 or below -00. Or, when the Stochastics is above 80 or below 20. Or, if the MACD is above zero or below zero. Those numeric values are threshold levels/values.
When the input value falls between threshold levels the output value is calculated by linearly interpolating between the corresponding Output values.
Tip: If you want to compare an indicator to another indicator, or bar prices, or some other non-fixed numeric value, then use the Comparison solver.
Parameters
Input
Thresholds
Please note, Threshold values must be entered in descending order.
I.E #1 A = 5, B = 4, C = 3, D = 2, E = 1
#2 A = 2, B = 1, C = 0, D = -1, E = -2
Long Output
Short Output
Sets the solver’s Short output values as described in Long Output above.
Video Tutorial
This video is from our weekly Workshop on July 10th, 2015.
For more benefit please watch in full screen mode, as this video is recorded in HD.
Examples
Example 1A: The Basics
This demonstrates the basic function of Indicator Threshold solver using the Stochastic D. This Solver will be used to detect over-bought, above 80, and over-sold, below 20, conditions of the Stochastic D. In this first example the 50 line of the Stochastic will be used to switch the output between Long and Short.
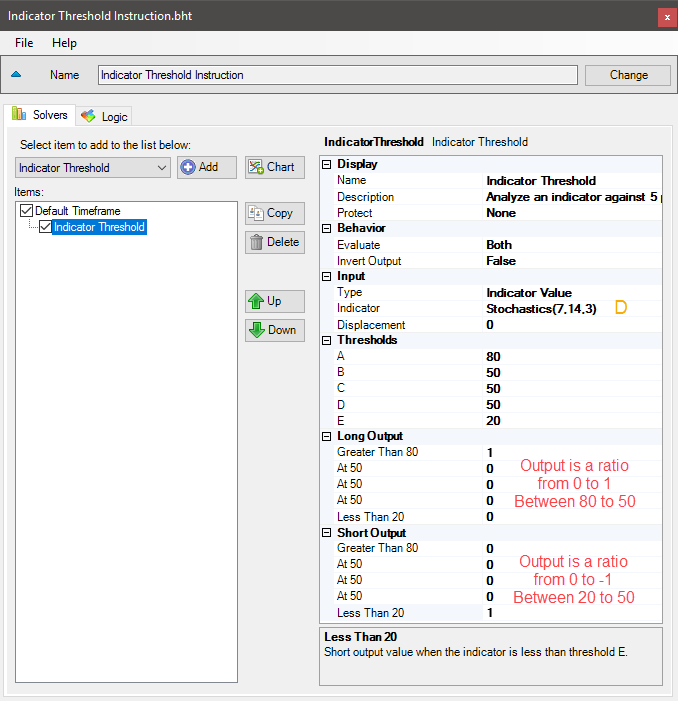
- Add the Indicator Threshold solver
- Set Indicator to Stochastic D
- Set Thresholds values as shown
- Set Long Output > Greater Than 80 to 1
- Set Short Output > Less Than 20 to 1
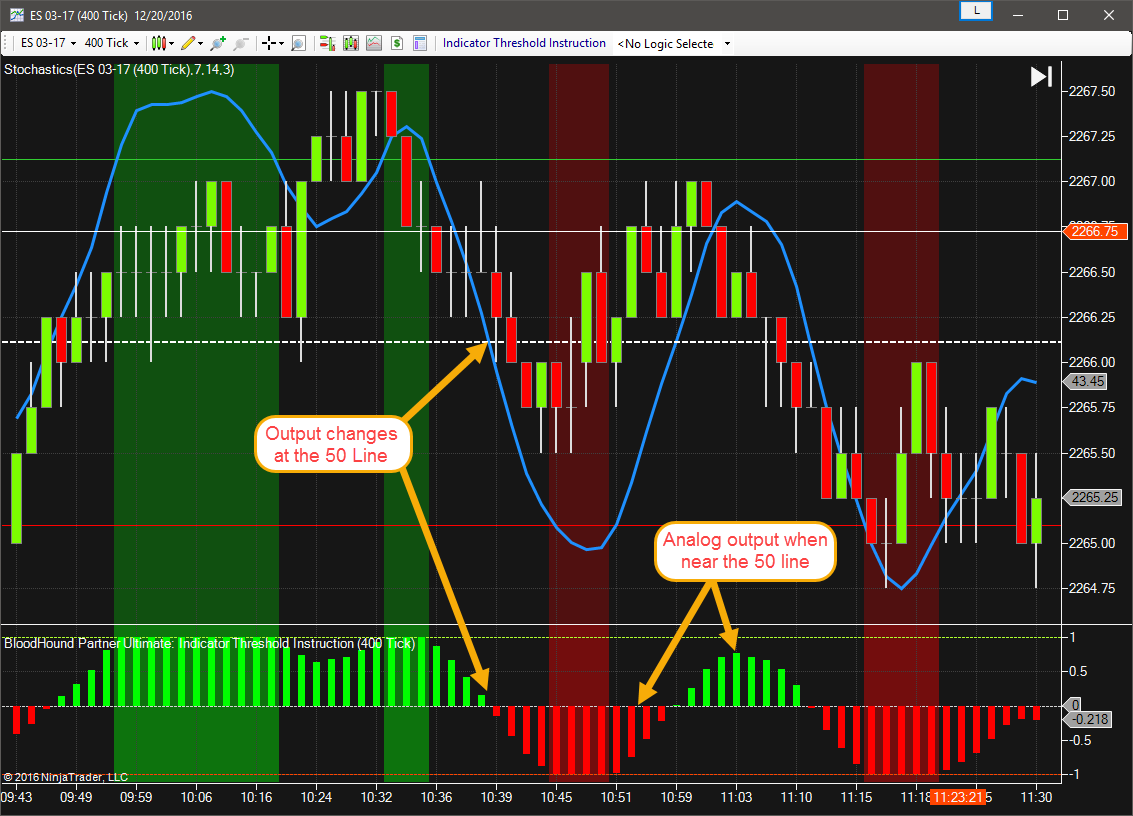
The chart below shows a Long output when the Stochastic D is above the 50 line, and a Short output when it is below the 50 line.
Example 1B: The Basics of Going Digital
This demonstrates the basic function of Indicator Threshold solver using the Stochastic D. This time the Solver will be set to give a digital style output.
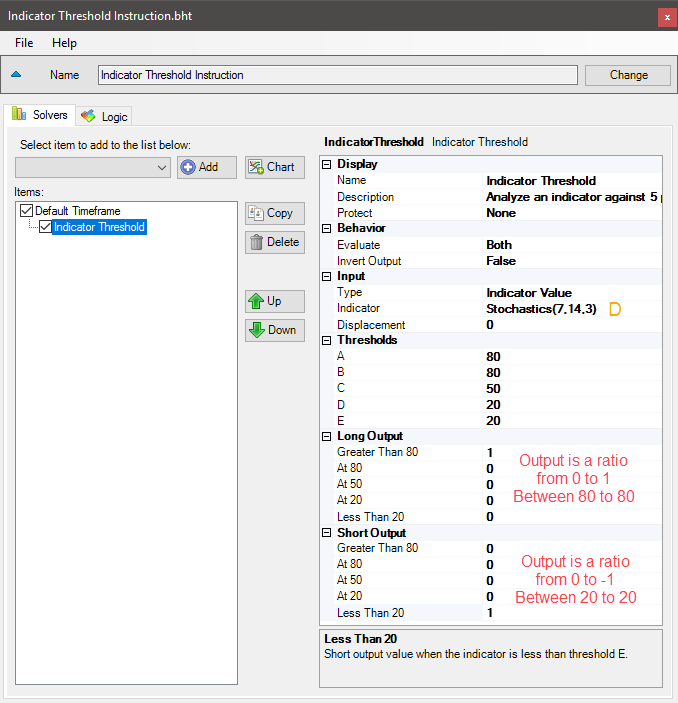
- Add the Indicator Threshold solver
- Set Indicator to Stochastic D
- Set Thresholds values as shown
- Set Long Output > Greater Than 80 to 1
- Set Short Output > Less Than 20 to 1
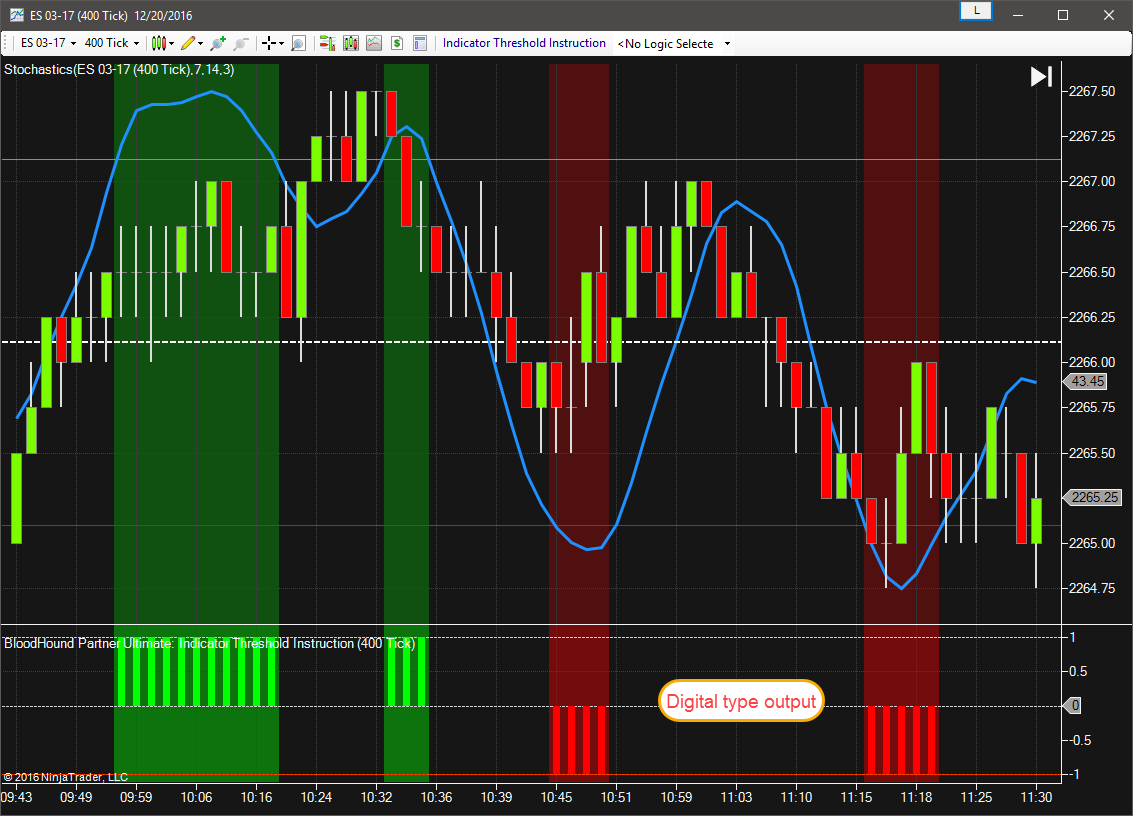
Notice that At B & At C are set to 0, and thus no output values between 20 to 80. The chart below only shows values above 80 and below 20.
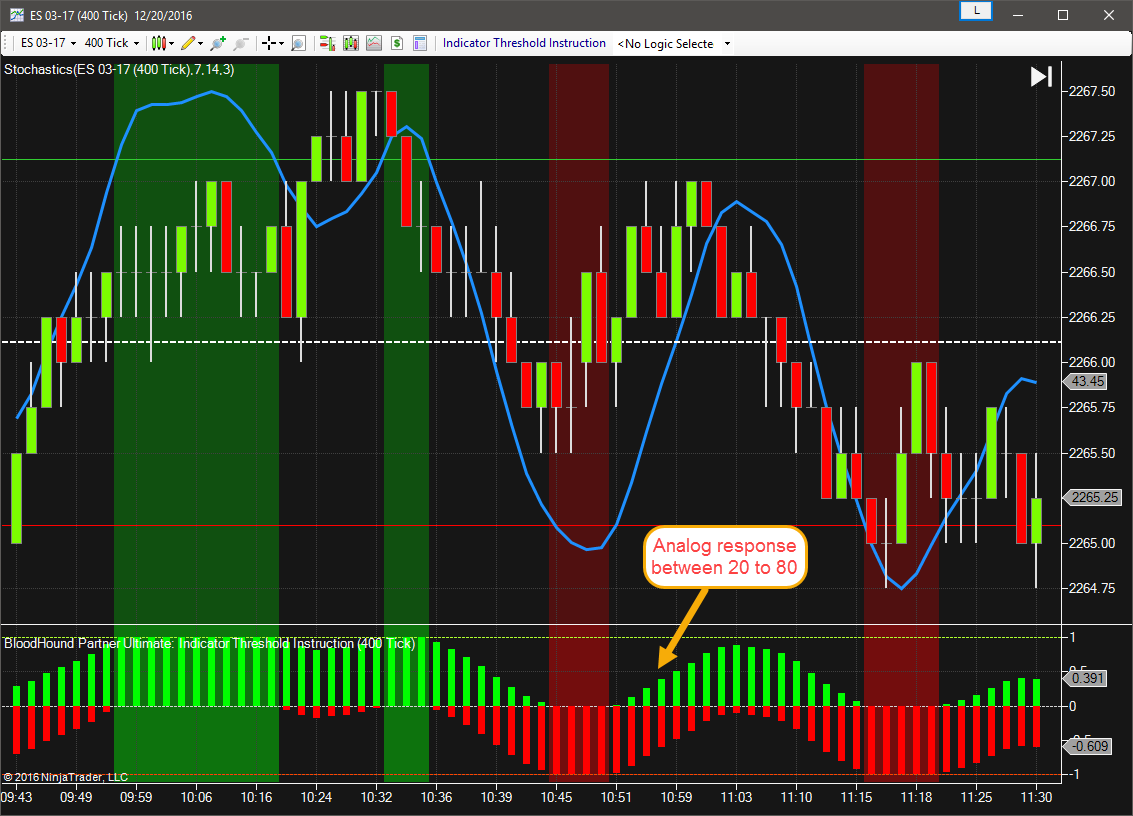
Example 1C: The Basics of a Smooth Transition
This demonstrates the basic function of Indicator Threshold solver using the Stochastic D. In this example the Solver’s output will transition between outputs always totaling 1. As the Long output increases the Short output decreases, and vise versa.
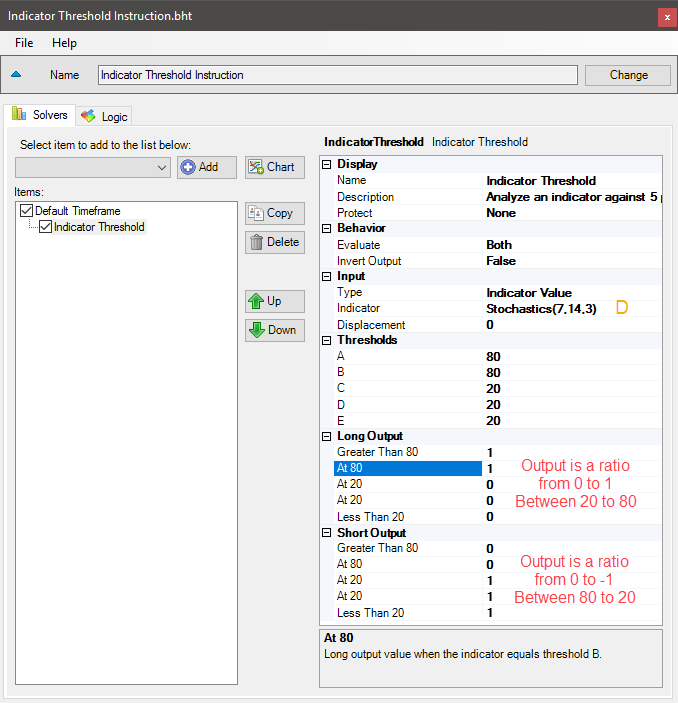
- Add the Indicator Threshold solver
- Set Indicator to Stochastic D
- Set Thresholds values as shown
- Set Long Output > Greater Than 80 & At 80 to 1
- Set Short Output > At 20 & Less Than 20 to 1
The chart below shows a Long output when the Stochastic D is above 20, and a Short output when it is below 80.
Example 2: A Basic MACD Filter
This demonstrates the basic function of Indicator Threshold solver using the MACD line. This Solver will be used to detect if the MACD is above the zero line for a Long(buy) filter, or below the zero line for a Short(sell) filter. The zero line threshold of the MACD will be used to switch the output between Long and Short.
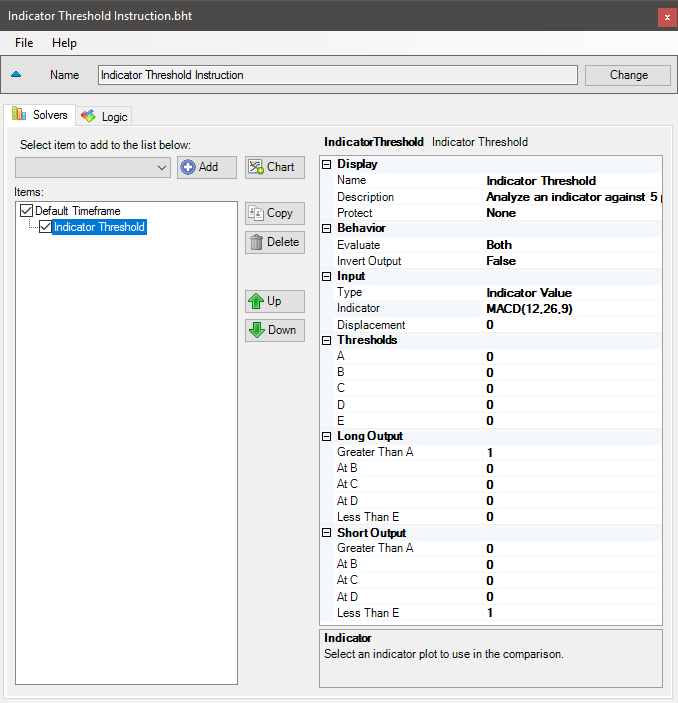
- Add the Indicator Threshold solver
- Set Indicator to the MACD
- Leave the Thresholds values at zero
- Set Long Output > Greater Than A to 1
- Set Short Output > Less Than E to 1
The chart below shows a Long output when the MACD is above zero, and a Short output when it is below zero.