HeatMap Pro
For NinjaTrader 8
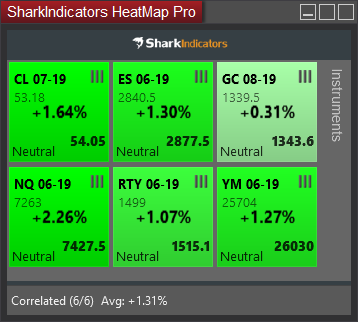
The HeatMap Pro provides a quick, simple, & easy to read visual display of the current market change relative to yesterday’s market close. The bottom panel informs you when the markets are correlated in the same direction or mixed. In addition, the Trend Bars display the trend direction for each market/instrument. The market’s percent change is traditionally calculated by taking the currently traded price and subtracting it from yesterday’s Closing price.
Prerequisites
Opening a HeatMap
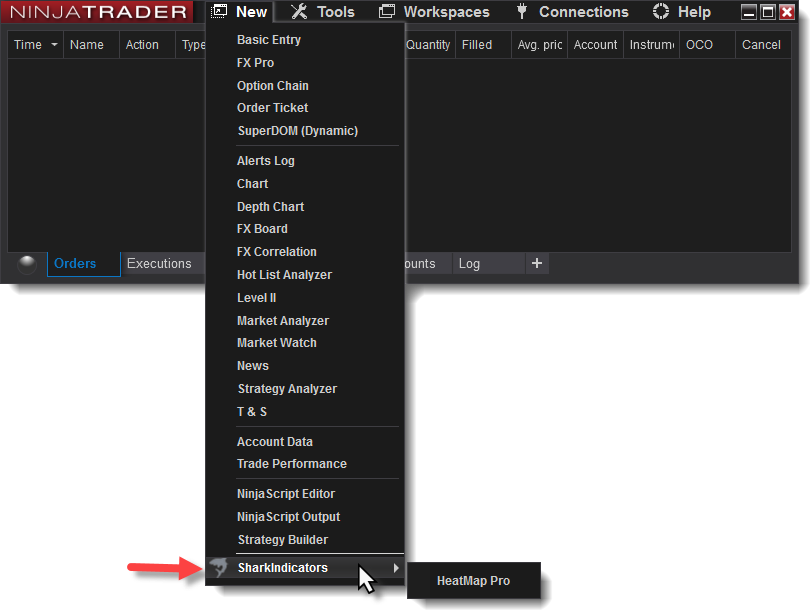
The HeatMap is not an indicator. It is a new class of tool that NinjaTrader calls AddOn Framework. Opening a new HeatMap is similar to opening a new chart.
- Go to the Control Center.
- Click on the New menu.
- Go to SharkIndicators, at the bottom, and you will see the HeatMap there.
Tile Components
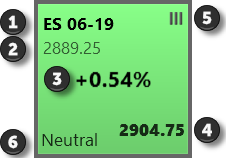
Each instrument you add to the HeatMap is displayed in a tile.
 The tile's instrument.
 The prior market closing price. See the Data Feed Connections section below on how this price is obtained
 The percent change between prior session close and the current last price.
 The current market price. The Last price.
 The Trend Bars use a 1-minute chart period to determine a short term trend.
  Green up trend bars will display when the last three minute bars are all up.
  Red down trend bars will display when the last three bars are all down.
  Gray neutral bars are shown when the last three bars are mixed up & down.
 The direction of the trend bars (#5).
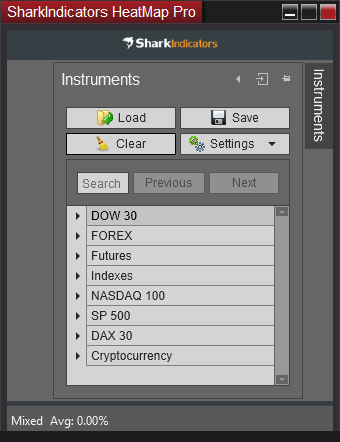
Instruments menu
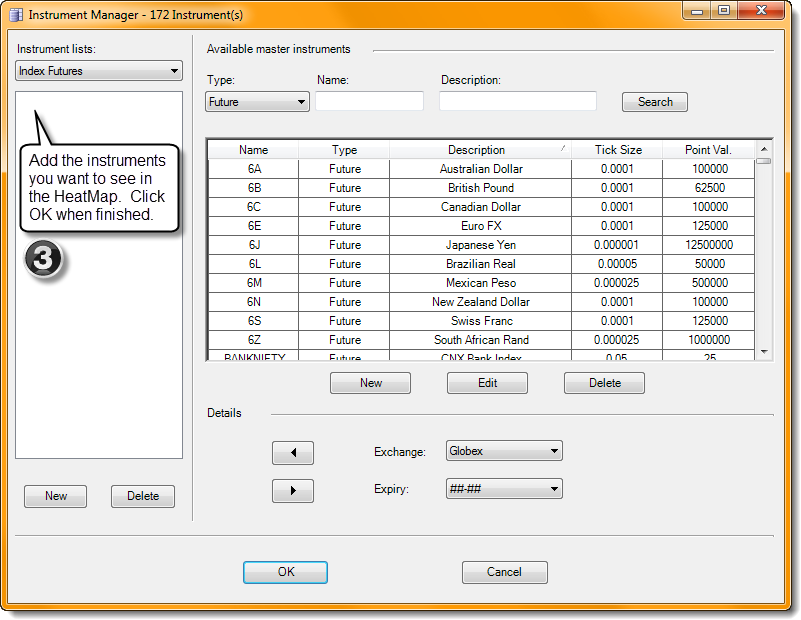
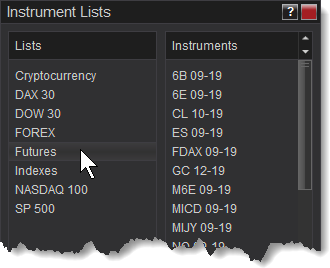
To add instruments to the HeatMap, double click on the instrument category, seen at the bottom, to add all the instruments within that category.
Or, to add individual instruments click the triangle (on the left) to expand the category and double click on the individual instruments.
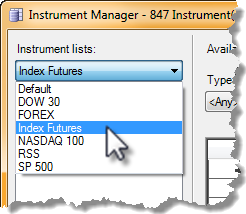
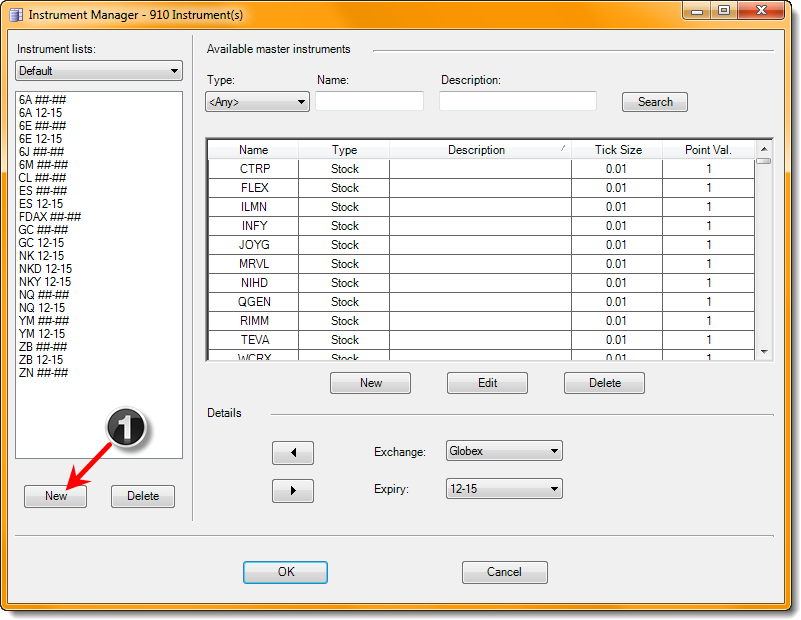
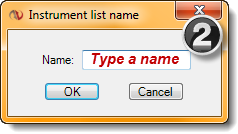
If an instrument can not be found you will need to add it to NinjaTrader's Instrument List, found in the Control Center. The categories of instruments come from NinjaTrader's Instrement List component.
Buttons
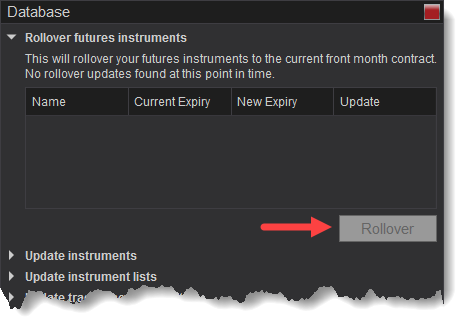
Rollover of Futures Instruments
Data Feed Connections
Prior Session Close Price
MarketData.LastClose: Your data feed MUST provide the instrument's prior session Close price. NinjaTrader calls it MarketData.LastClose. That special price is not calculated by HeatMap or NinjaTrader. It comes from the exchange to your data feed provider, and then to NinjaTrader. If your data feed does not support MarketData.LastClose, HeatMap tiles will display "No data" or "loading".
NinjaTrader support has a list of data feed providers to identify which ones support .LastClose. See the Data by Provider page. The "Settlement adjusted Close Price For Daily Bars" column must be marked YES.
Indexes and Non-tradable Instruments: According to NinjaTrader support, non-tradable instruments do not have a MarketData.LastClose value. e.g. ^DJIA, ^SP500, ^VIX.
Playback Connection data feed
The Playback Connection calculates the prior session Close price when the instruments's RTH session ends. What this translates to for the Heatmap is the Playback Connection must start playing just before the prior day's instrument closing time, and when the after hours market reopens the Playback Connection will have the prior session Close price and the Heatmap will then display correctly.
Tip: Do Not move the Playback Connection slider. The Playback Connection loses the MarketData.LastClose price (last session Close price) when the slider is moved.
i.e. Fast forward the Playback Connection past the first trading day. When the market reopens in the after hours session(approx. 6:00PM Eastern Time, UTC -5) the Heatmap will start working, as the beginning of the new session is when the Playback Connection makes the MarketData.LastClose price available. Then you can fast forward to the next day's market open.
HeatMap Pro
For NinjaTrader 7
The HeatMapPro provides a quick, simple, & easy to read visual display of the current market change relative to yesterday’s close or the market open. The bottom panel informs you when the markets are correlated in the same direction or mixed. In addition, the Trend Bars display the trend status for each market. The market’s percent change is traditionally calculated by taking the currently traded price and subtracting it from yesterday’s Closing price. Our HeatMap can also show the percent change from the market Open.
Prerequisites
Parameters
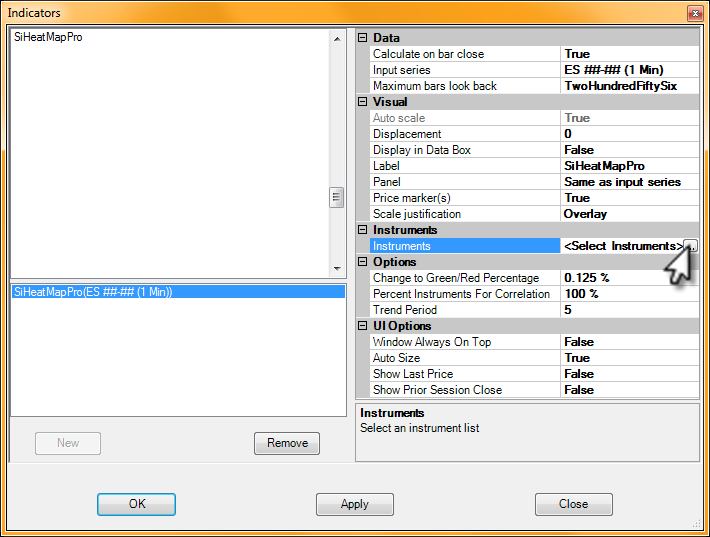
Instruments
Options
UI Options
Data Feed Connections
Live data feed
Your data feed provides the instrument's Last Session Close price. That price is not calculated by the Heatmap or NinjaTrader. It comes from the exchange to your data feed provider and then to NinjaTrader. If the data feed does not support MarketData.LastClose, HeatMap tiles will not be able to display the market change. NinjaTrader support has noted that FXCM and Forex.com does not support .LastClose.
Market Replay data feed
The Market Replay calculates the Last Session Close price when the instruments's RTH session ends. What this translate to for the Heatmap is the Market Replay must be fast forwarded to the instrument's closing time and when the after hours market reopens the Market Replay will receive the Last Session Close price and the Heatmap will then start working. Do Not move the Market Replay slider. The Market Replay loses the Last Session Close price when the slider is moved.
I.E. Fast forward the Market Replay data past the first trading day. When the market reopens in the after hours session the Heatmap will start working. Then you can fast forward to the next market open.
Additional information is available on the NinjaTrader Support Forum. Post #1. Post #2.

